
Kehinde Ojo
Data Analyst | Financial Analyst
Making numbers and data tell the story behind smarter business decisions
Making numbers and data tell the story behind smarter business decisions
I believe every number has a story to tell.
My passion is uncovering those stories and turning them into strategies that help businesses grow.
I’m Kehinde Ojo, a Data & Financial Analyst with a B.Sc in Accounting from the University of Lagos and a strong background in business operations. I use data to solve problems, improve performance, and guide smarter decisions.
On the data side, I uncover trends, track KPIs, automate workflows, and build dashboards with Excel, Power BI, SQL, and Python.
On the finance side, I focus on modeling, forecasting, reporting, and cost optimization to help teams make confident, informed choices.
In real terms, that has meant recovering ₦5M through audits, improving efficiency by 30% with automation, and designing dashboards that cut reporting time by 25%.
Whether it’s analyzing transactions, optimizing costs, or forecasting growth, I enjoy making complex information clear and actionable.
Leveraging tools like SQL, Excel, Power BI, and Python, I design data-driven solutions that streamline operations, elevate financial clarity, and uncover hidden opportunities for growth.
I’m open to freelance, full-time, or collaborative opportunities in Data Analysis or Financial Analysis, where I can apply my skills to create measurable business impact.
Issuer:
 CWW Tech Africa
Achievement: Graduated with Distinction
Skills Covered: Excel, SQL, Power BI, Python, Business Insight.
View Certificate
Issuer:
 Great Learning
Focus: Basics of data analytics, types of analytics, and decision-making with data.
View Certificate
Issuer:
 Code With Mosh
Skills Covered: Python basics, data manipulation, scripting, automation.
View CertificateInstitution: University of Lagos
Recognized among top participants in the Data Analysis Program for outstanding project execution, collaboration, and consistent growth in Excel, SQL, Power BI, and Python.
Successfully identified and corrected financial discrepancies on multiple occasions, leading to the recovery of more than ₦5 million. These audits significantly improved financial reporting accuracy and accountability within the organization.
Designed and coded a responsive portfolio from scratch using HTML and CSS to showcase data projects, certifications, and career journey. Visit Website
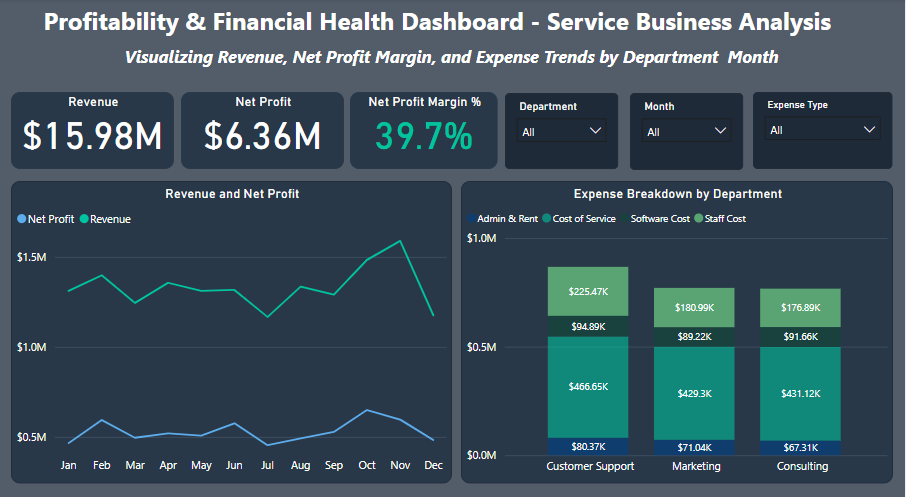
Analyzed a service-based company’s financial data to uncover trends in revenue, profit margins, and departmental expenses. Used Python for exploratory data analysis and Power BI for interactive dashboards, highlighting cost drivers and guiding strategies to improve profitability.
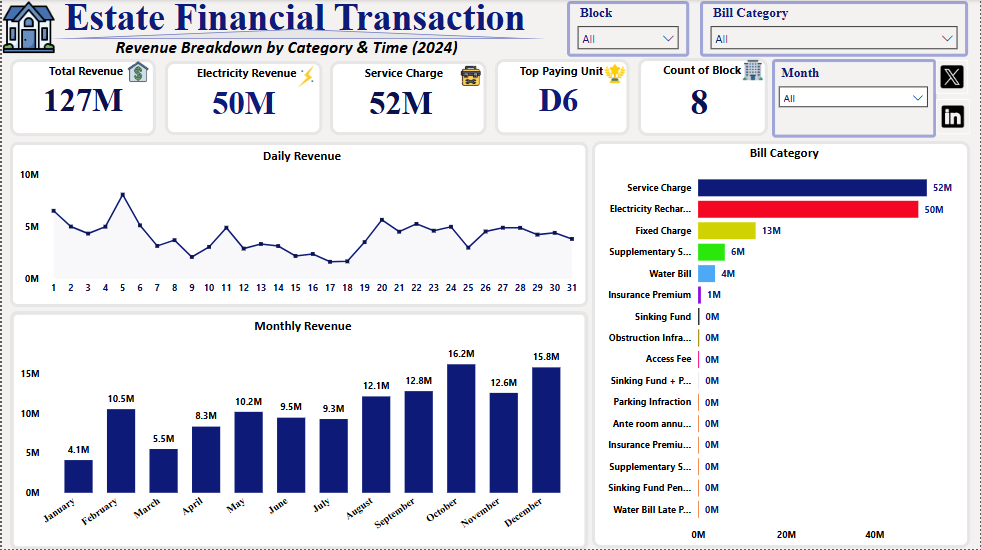
Designed a financial tracking system for a residential estate, analyzing revenue flow, top-paying units, and income distribution across bill categories. Built an interactive dashboard in Power BI with SQL and Excel, enabling stakeholders to filter by block, bill type, and time for smarter financial decisions.
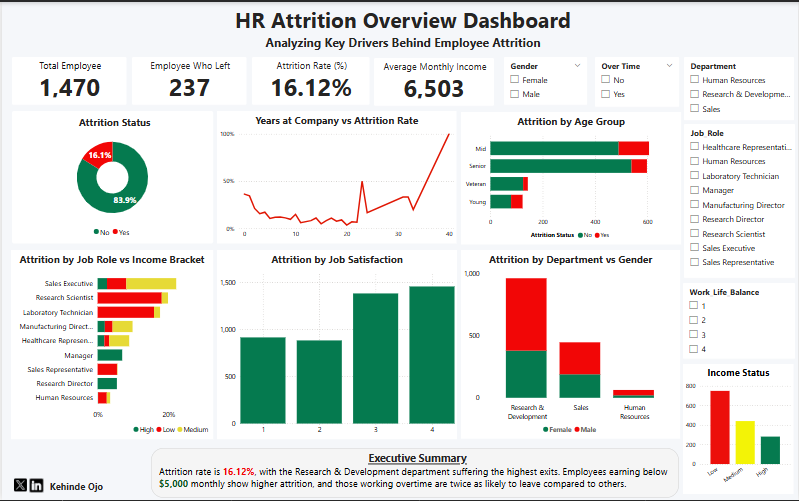
Analyzed HR datasets to uncover drivers of employee attrition. Built an interactive Power BI dashboard powered by SQL and Excel, highlighting risk factors like job role, tenure, and work-life balance to support HR retention strategies.
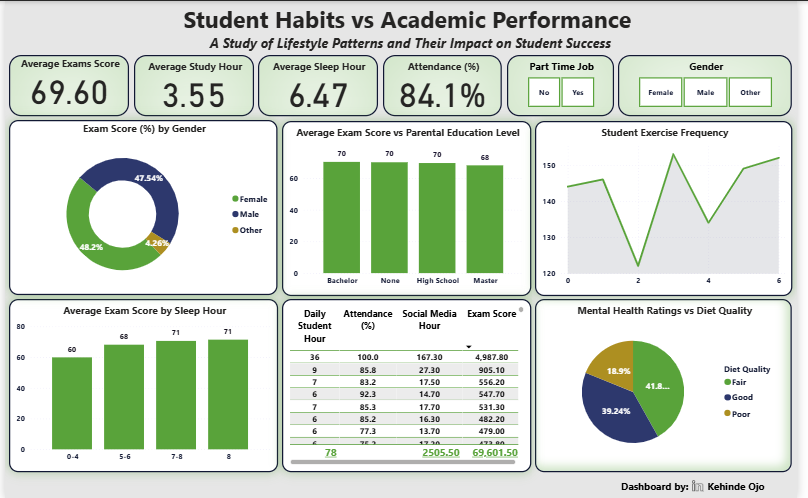
Explored the relationship between students’ lifestyle habits (study hours, sleep, attendance, exercise, and mental health) and exam performance. Built an interactive dashboard in Power BI to visualize key patterns that influence academic outcomes.
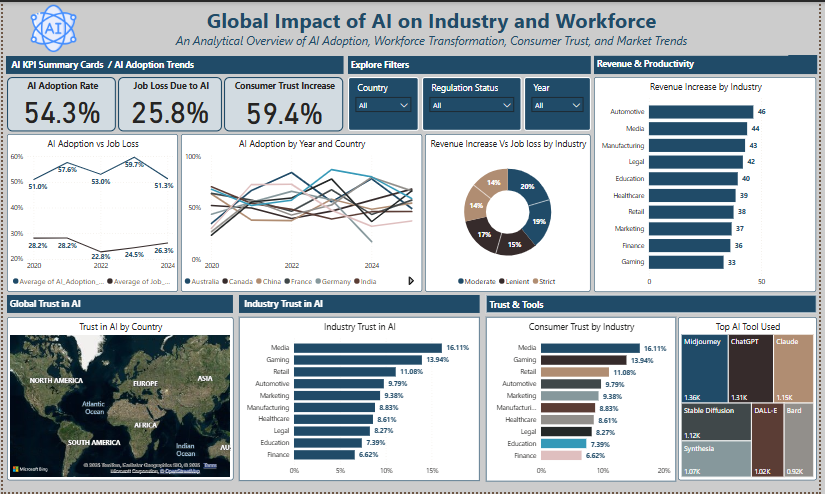
Investigated the impact of AI adoption on industries, workforce, and regulation across countries. Used Python for data cleaning and analysis, then designed a Power BI dashboard highlighting AI-driven trends in jobs, growth, and trust for policymakers and stakeholders.
Built an Excel-based inventory tracker to manage inflow and outflow of construction materials. Integrated KPIs and visual indicators to monitor stock levels in real time, ensuring materials were available when needed and reducing waste on site.
Aug 2025 – Present
Jan 2021 – Jul 2025
Oct 2015 – Jan 2020
Feel free to reach out to me
Email: kehindeojo202@gmail.com